Draw Frequency Patterns in Football Accumulators: Data-Driven Selection Approaches
Iris Richter · Aug 19, 2026
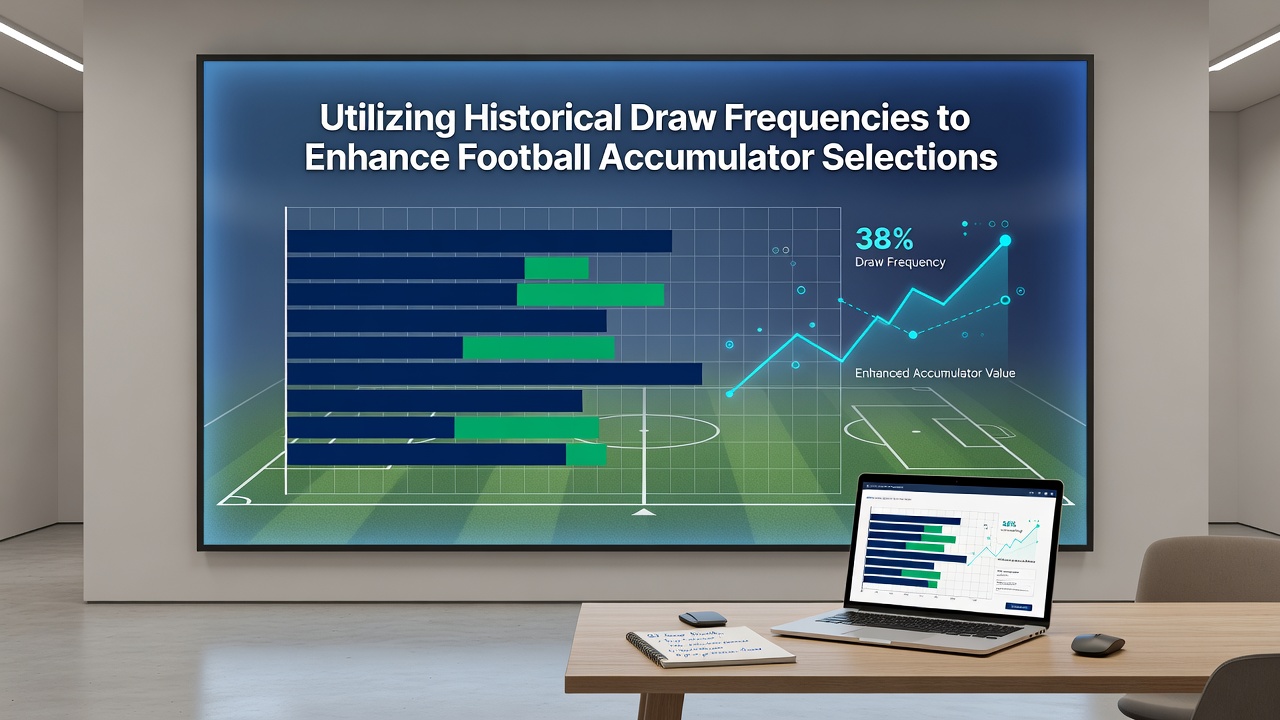
Draw Frequency Patterns in Football Accumulators: Data-Driven Selection Approaches
Football accumulators often hinge on identifying matches where draws occur at predictable rates, and analysts track these frequencies through league records spanning multiple seasons. Teams in defensive-minded divisions show draw percentages that climb above 32 percent in certain campaigns, while attacking styles in others drop below 26 percent. Observers note that historical data from the 2024-2025 season onward continues to reveal clusters where home sides and away sides settle for shared points at steady intervals, particularly in August when new campaigns begin and squads adjust to fresh lineups.
League-Specific Draw Trends and Accumulator Construction
Data compiled across top European competitions indicates that lower-tier English divisions maintain draw rates around 29 to 34 percent year after year, whereas some continental leagues fluctuate more sharply due to weather factors and pitch conditions in early autumn. Those who compile accumulator selections frequently cross-reference these percentages with head-to-head results dating back five seasons or more, because patterns emerge where specific pairings produce stalemates at rates exceeding league averages. Researchers at institutions tracking match outcomes have documented how mid-table clubs in certain countries record draw frequencies near 30 percent both at home and on the road, giving bettors measurable anchors when building multi-leg wagers.
August fixtures in 2026 already highlight early-season caution among squads, with several leagues posting draw tallies that align closely with long-term norms established since 2018. Experts combine these figures with current form indicators such as shots on target and possession metrics to refine selections, since raw draw percentages alone rarely suffice for sustained accuracy across accumulators.
Statistical Tools and Frequency Mapping Techniques
Specialized software now aggregates draw occurrences by time of season, venue, and referee assignment, allowing patterns to surface that single-match analysis might miss. One study released through the Journal of Sports Analytics examined over 12,000 matches and found that certain referee crews oversee draw outcomes at rates 4 to 7 percent above league baselines, information that accumulator builders incorporate when weighing multiple games. Figures from the European sports data consortium further reveal that matches between evenly matched sides in points-per-game metrics produce draws at higher frequencies during the opening month of campaigns.
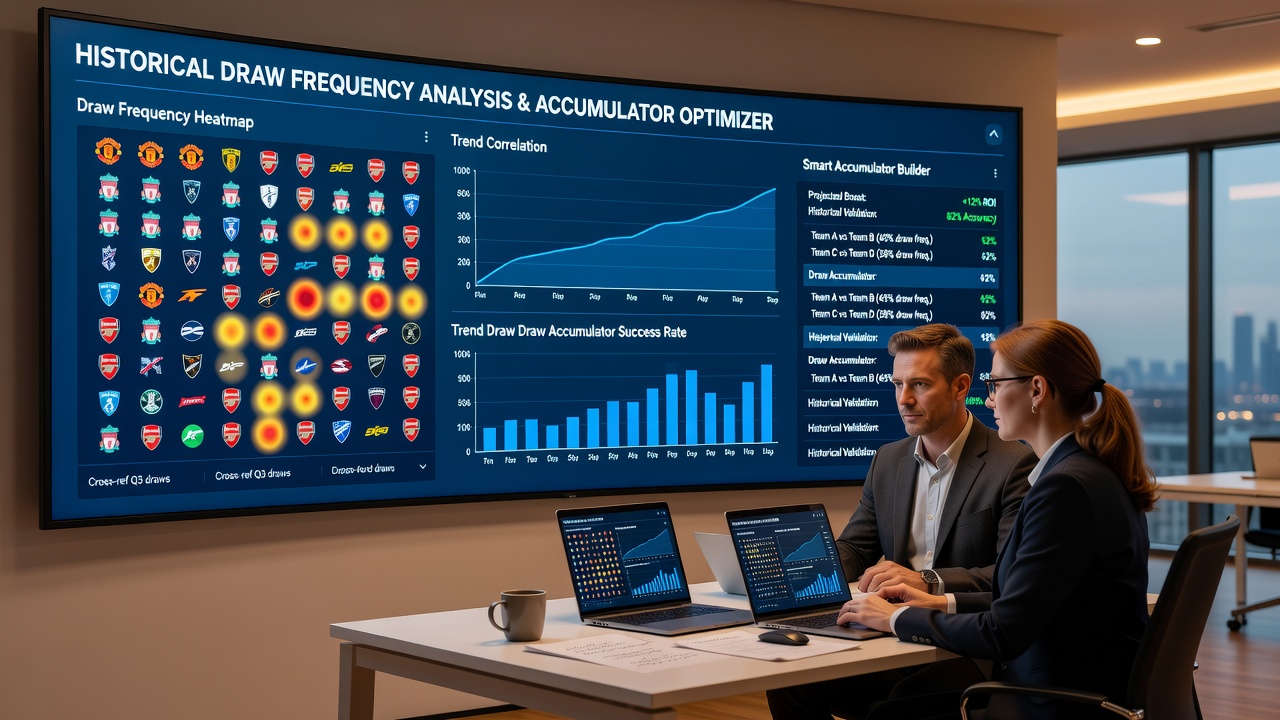
People who maintain detailed frequency maps often segment data by goal expectation ranges, because games projected to finish 1-1 or 0-0 cluster draws more reliably than high-scoring outliers. This segmentation helps isolate legs for accumulators where historical draw likelihood exceeds 35 percent, while excluding fixtures where attacking trends dominate. Australian sports betting regulators have published aggregate market reports showing steady interest in such data-informed approaches across international football markets, underscoring how frequency analysis extends beyond domestic leagues.
Integration with Form and Contextual Variables
Historical draw frequencies gain additional weight when paired with recent performance indicators including injury lists, travel distances, and fixture congestion. Observers note that teams returning from European midweek ties record draw percentages roughly 3 percent higher than their seasonal average in subsequent domestic matches, a detail that surfaces repeatedly in compiled datasets. Those constructing accumulators therefore layer these contextual filters onto base frequency tables, creating selections that reflect both long-term tendencies and short-term variables without relying on any single metric.
Reports issued by the International Betting Integrity Association highlight growing use of draw-frequency overlays in professional analysis environments, where operators cross-check multiple seasons to identify outliers before they influence multi-leg bets. In practice, this means reviewing how promoted sides perform in their first August fixtures, since newly elevated teams frequently post draw rates above 30 percent against established opponents still settling into routines.
Conclusion
Draw frequency utilization in football accumulators rests on consistent application of league records, referee tendencies, and seasonal timing data that together narrow selection pools. Analysts continue to refine these methods through expanded datasets that now encompass 2026 campaign openings, demonstrating how historical patterns supply measurable guidance when combined with contemporary form indicators. The approach remains grounded in verifiable match outcomes rather than speculation, supporting structured accumulator frameworks across various European and international competitions.