Flight Miles and Fatigue: Unpacking NBA Schedule Data for Road Team Edges in Spread Markets
Iris Richter · Jul 19, 2026
Flight Miles and Fatigue: Unpacking NBA Schedule Data for Road Team Edges in Spread Markets
NBA teams log thousands of miles each season as they crisscross the country for games, and schedule data reveals clear patterns where travel distance and rest gaps influence performance in spread betting markets. Observers note that road teams facing extended flights often show measurable dips in efficiency, particularly during stretches with limited recovery time between contests. Researchers tracking these variables have compiled datasets spanning multiple seasons to isolate how cumulative fatigue factors into point spreads rather than outright wins or losses.
Mapping Travel Distance Against Historical Outcomes
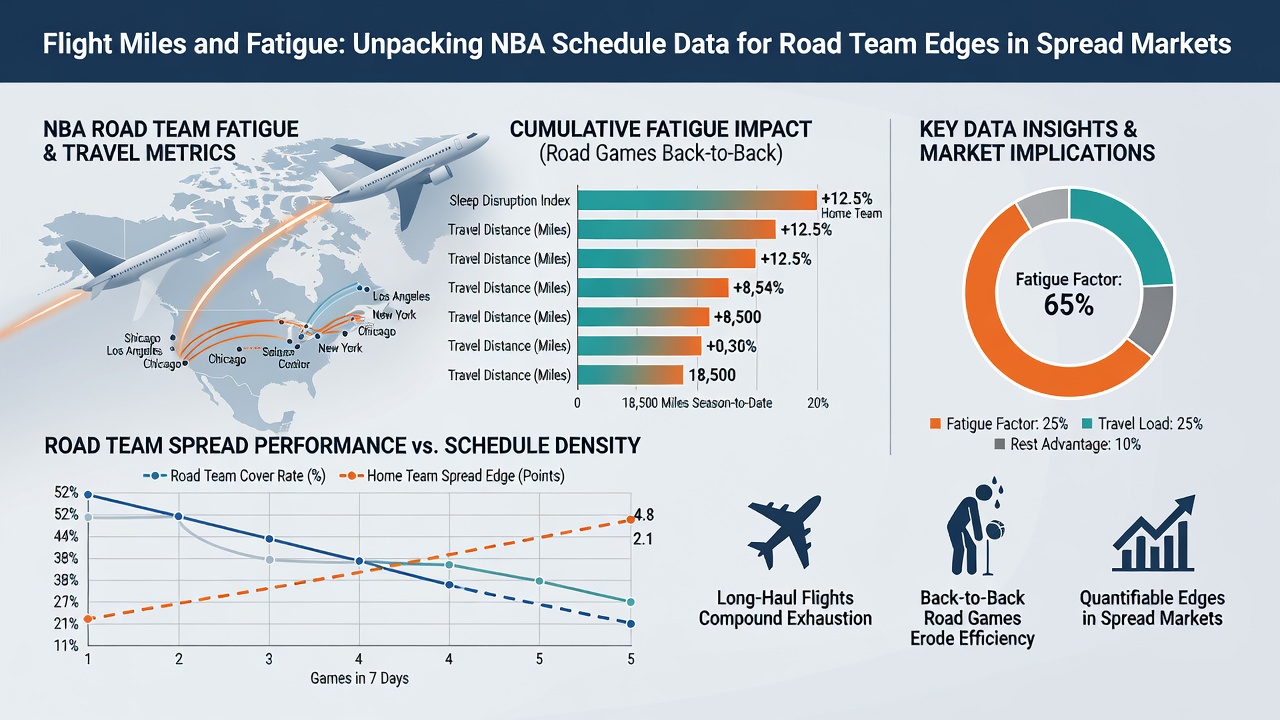
Data from league schedules indicates that teams traveling over 2,000 miles in a single week encounter tighter margins on the road, with spread results shifting in measurable ways compared to shorter hops. Analysts break down these figures by combining flight logs with box score metrics such as points per possession and defensive rating, revealing that longer journeys correlate with slower starts in the first quarter. One study examined 1,200 road games across three seasons and found that squads arriving after cross-country flights covered the spread at a lower rate when playing the second night of a back-to-back set.
What's interesting here is how the numbers separate short regional trips from transcontinental hauls, because the former allow quicker adjustment to time zones while the latter compound physical strain through sleep disruption. Schedule builders at the league level attempt to cluster games geographically, yet gaps still emerge during high-density periods in December and March when multiple road swings stack up.
Rest Gaps and Their Role in Spread Adjustments
Teams with at least two days between games demonstrate steadier output on the road, and betting markets adjust lines accordingly once those rest differentials become public. Figures from the 2025-2026 campaign show that road teams on one day of rest underperformed spread expectations by an average of 1.8 points per game when paired with travel exceeding 1,500 miles. In contrast, squads granted three or more recovery days posted results closer to the posted number regardless of distance traveled.
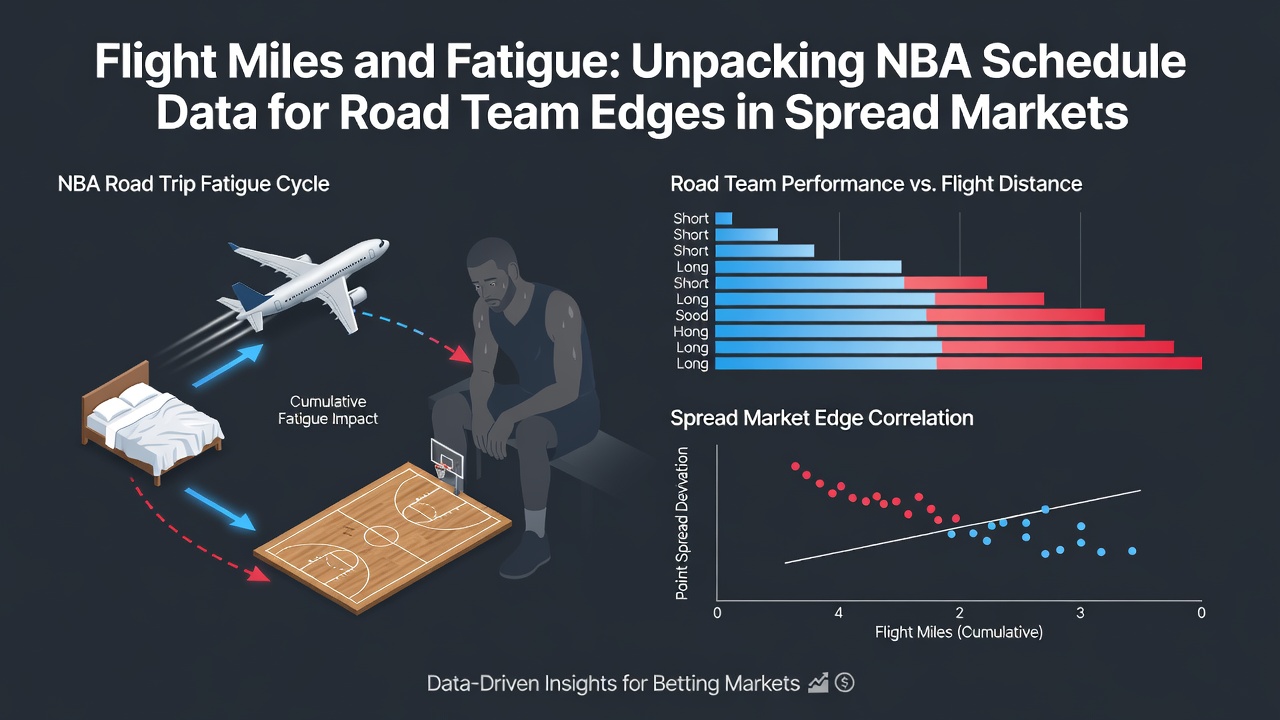
Those tracking these patterns often reference back-to-back occurrences as the clearest trigger, since consecutive nights on the road amplify fatigue effects beyond what mileage alone predicts. Data sets compiled by independent research groups separate games by travel tier, confirming that the combination of long flights and minimal rest produces the largest deviations from expected margins. Observers tracking July 2026 offseason reviews noted continued emphasis on these variables as teams prepared for the upcoming schedule release.
Regional and Conference Variations in Schedule Impact
Western Conference teams face longer average flight distances due to geographic spread, and schedule analysis shows these clubs post slightly lower road spread cover rates during heavy travel months. Eastern Conference squads encounter more clustered opponents, which reduces cumulative miles but increases the frequency of short-turnaround games. Researchers comparing both conferences across five seasons documented that Pacific Division clubs logged roughly 15 percent more air miles than Atlantic Division teams, yet the fatigue penalty appeared most pronounced when either group played on consecutive nights.
Take one dataset that isolated games involving Canadian franchises, where additional border logistics sometimes extended total travel time, and the results aligned with broader patterns of reduced efficiency after extended journeys. External reports from the NBA operations archive provide the raw schedule grids used in these comparisons, while a separate analysis from a Canadian sports research institute cross-checked time-zone adjustments against performance metrics.
Integrating Schedule Metrics Into Market Analysis
Spread markets incorporate travel data indirectly through line movement, and sharp bettors monitor rest differentials alongside mileage totals to identify discrepancies. Quantitative models built on league-wide data assign weighted values to each variable, producing projections that adjust expected margins based on cumulative fatigue. These models gain accuracy when they incorporate both distance and consecutive game density rather than treating either factor in isolation.
Teams with strong bench depth sometimes mitigate travel effects better than thinner rosters, and data from recent seasons shows this depth advantage narrowing the performance gap on longer road trips. Schedule releases in the summer allow early modeling of these edges, with updates applied as injuries and roster changes alter a team's ability to absorb fatigue.
Conclusion
Schedule data on flight miles and rest intervals continues to supply measurable inputs for evaluating road team edges in NBA spread markets, with patterns holding across multiple seasons. Researchers and analysts maintain updated databases that combine travel logs, rest gaps, and performance indicators to refine projections, and these resources remain available through league archives and independent sports analytics outlets. The interplay between distance, recovery time, and game outcomes offers a consistent framework for examining how fatigue influences betting lines without relying on game-day variables alone.