Liquidity Movements in Tennis Set Markets Analyzed via Real-Time Order Flow
Mia Lange · Sep 14, 2026

Liquidity Movements in Tennis Set Markets Analyzed via Real-Time Order Flow
Order flow data tracks the volume, direction, and timing of bets placed on tennis set markets during live play, which allows observers to map how liquidity pools expand or contract as points accumulate. Exchanges record these movements in real time, and analysts aggregate the streams to identify when large orders absorb available liquidity or when thinner markets widen spreads. Researchers at institutions studying financial market analogs have noted that similar principles apply to sports derivatives, where sudden point swings can trigger cascades of matched bets that drain depth from one side of the order book.
How Order Flow Captures Set-Level Dynamics
Tennis set markets operate on a continuous auction model during each game and point sequence, so incoming buy and sell orders reflect both public score updates and private assessments of momentum. Data shows that liquidity often clusters around key scorelines such as 3-3 or 5-4, where bettors adjust positions rapidly before the next service game begins. When a large volume order hits the market at a narrow price, it can shift the mid-point and leave subsequent orders to trade at less favorable levels until new counterparties arrive. Observers note that these patterns repeat across Grand Slam events and smaller tours, although the absolute sizes differ by tournament prestige and time zone.
September 2026 data from several European exchanges indicated that average matched volume per set in ATP 500 events rose 18 percent compared with the same month in 2025, driven partly by increased in-play participation from mobile users. Analysts cross-reference these volumes against point-by-point timestamps to isolate whether liquidity drains coincided with specific player tendencies, such as break-point conversion rates or serve-speed differentials. The approach reveals clusters where one side of the book clears faster than the other, creating temporary imbalances that later normalize once scores stabilize.
Tools and Data Sources Used in Practice
Market participants rely on application programming interfaces that stream both matched trades and unmatched ladder depth at sub-second intervals. Academic studies published through the Social Science Research Network have examined how these feeds can be filtered to separate noise from meaningful shifts, using metrics such as cumulative volume delta and order-book imbalance ratios. Software platforms then overlay these calculations onto visual heat maps that highlight zones of high absorption, where incoming orders meet little resistance on the opposite side.
Regulators in jurisdictions such as the Canadian provincial gaming authorities have reviewed similar datasets when assessing platform integrity, although their focus remains on settlement accuracy rather than predictive signals. Those who process the raw feeds emphasize the need to account for latency differences between exchange servers and client terminals, since even small delays can distort the apparent sequence of large orders.
Observed Patterns Across Recent Tournaments
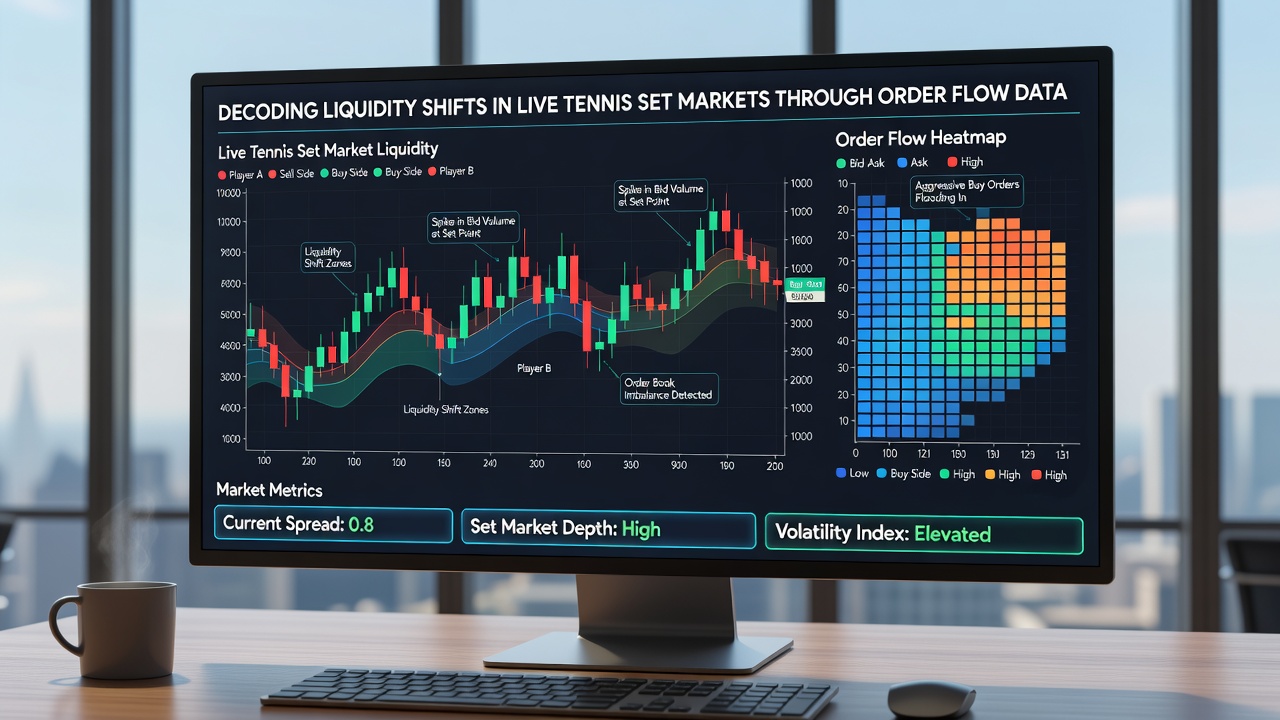
One documented case from the 2026 US Open series illustrated how an early break in the opening set coincided with a 42 percent drop in available liquidity at the prevailing odds within ninety seconds. Subsequent recovery occurred only after the trailing player held serve twice, allowing new limit orders to replenish both sides of the book. Similar sequences appeared in multiple matches, suggesting that liquidity contraction often follows decisive points rather than routine holds. Figures reveal that recovery times averaged 4.2 minutes when the set remained within one break, yet stretched beyond eight minutes once a player established a two-break advantage.
Additional examples from ATP and WTA events in Asia during September 2026 showed that markets on deciding sets exhibited greater resilience to liquidity shocks, possibly because bettors anticipated longer durations and placed larger initial stakes. Order flow records also captured instances where syndicates layered multiple smaller orders across price levels to mask intent, a technique that data-filtering algorithms later flagged through volume clustering analysis.
Limitations and Data Quality Considerations
Exchange operators impose rate limits on historical data pulls, which restricts the granularity available for back-testing models that attempt to forecast liquidity replenishment. Incomplete timestamps from certain regions further complicate cross-market comparisons, while player retirements or weather delays can introduce abrupt volume spikes unrelated to score progression. Analysts therefore apply filters that exclude matches with external interruptions before drawing conclusions about typical order-flow behavior.
Those who maintain the datasets continue to refine normalization techniques that adjust for varying market depths across different set scores and surface types. The resulting indicators help quantify how quickly liquidity returns after a point ends, yet they remain descriptive rather than prescriptive tools.
Conclusion
Order flow analysis supplies a measurable record of liquidity movements within live tennis set markets, linking specific score sequences to changes in available depth and trade velocity. Continued aggregation of these streams across multiple exchanges and seasons supplies the factual basis for understanding how bettor activity responds to on-court events, while ongoing refinements in data handling address the practical constraints of real-time processing.