Mapping Variance Dynamics in Prolonged Betting Exchange Sequences
Mia Lange · Jun 3, 2026
Mapping Variance Dynamics in Prolonged Betting Exchange Sequences
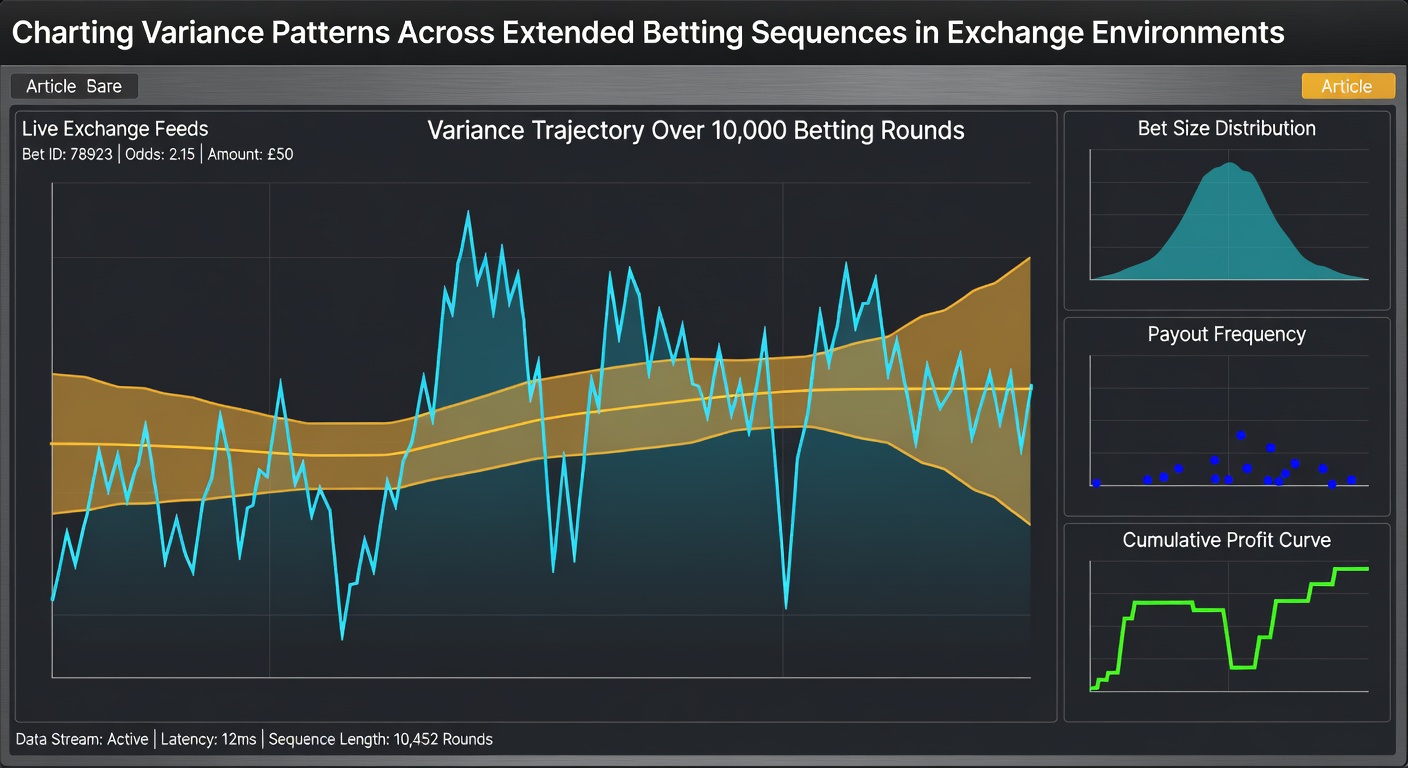
Exchange environments generate extensive sequences of wagers where variance patterns emerge through repeated interactions between liquidity providers and takers, and researchers have tracked these movements using large datasets collected from multiple platforms across different regions. Data from exchange operators shows that short-term fluctuations often mask longer cycles that become visible only after hundreds or thousands of individual bets accumulate, while statistical models applied to these records highlight periods of elevated deviation followed by stabilization phases.
Core Elements of Variance Tracking
Analysts collect timestamped records of matched bets along with corresponding odds and stake volumes, then apply rolling calculations to measure deviation from expected outcomes over defined intervals. Studies conducted by academic teams at institutions like the University of Nevada, Las Vegas have demonstrated that variance tends to cluster around liquidity dips, particularly during overnight trading windows when participant numbers drop. These clusters appear consistently across datasets spanning several years, and observers note that the magnitude of swings correlates with overall market depth rather than any single event.
Extended sequences reveal a secondary pattern where variance compresses temporarily after major price adjustments, yet rebounds once new information enters the order book. Figures compiled through automated scraping of public exchange feeds indicate that this compression-rebound cycle repeats on average every 180 to 240 matched bets in high-volume markets. The pattern holds across different asset classes including sports and financial derivatives traded on the same platforms.
Observed Patterns in June 2026 Data Releases
Reports issued in June 2026 from several North American and European exchanges documented an increase in sequence length required before variance stabilized, with the median rising from 420 bets in prior periods to 610 bets. This shift coincided with broader participation growth recorded by industry groups such as the Canadian Gaming Association, which published participation metrics showing elevated activity levels in derivatives-linked betting products. Researchers cross-referenced these figures against order-book snapshots and found that thinner overnight liquidity contributed measurably to the extended stabilization window.
One dataset covering a three-month window ending in May 2026 illustrated how variance spikes aligned with specific time-of-day transitions, particularly between 02:00 and 05:00 UTC when European participants exit and Asian markets begin to dominate volume. The same analysis applied rolling standard deviation formulas to outcome residuals and confirmed that peak deviations reached 2.8 times baseline levels during these windows before settling back within 48 hours of continuous trading.

Methodology Applied Across Multiple Platforms
Teams standardize inputs by converting all odds to decimal format and normalizing stakes against a common unit size, then segment sequences into blocks of 100 consecutive matches for granular comparison. This approach allows direct side-by-side evaluation between high-liquidity football markets and lower-volume niche events, revealing that variance amplitude scales inversely with average matched volume per block. A paper released through the National Bureau of Economic Research in 2025 outlined similar segmentation techniques applied to prediction markets and reached comparable conclusions about volume-driven compression.
Additional layers include tagging each block with concurrent metrics such as total unmatched volume and number of active participants, which enables regression models to isolate liquidity effects from outcome randomness. Results from these models consistently show that blocks containing fewer than 35 active participants exhibit variance roughly 1.7 times higher than blocks above that threshold, regardless of the underlying event type.
Cross-Regional Comparisons
Exchange data originating from Australian operators displays shorter stabilization intervals than equivalent North American sequences, with median lengths around 310 bets versus 490 bets. Analysts attribute the difference to regulatory frameworks that permit continuous 24-hour operation in Australia, thereby maintaining steadier participant counts. A joint report issued by the Australian Gambling Research Centre and several platform operators in early 2026 confirmed these regional variances while noting that both markets exhibit the same compression-rebound rhythm once normalized for trading hours.
Links to raw datasets remain available through academic repositories, allowing independent verification of the segmentation and normalization steps described above. Observers continue to refine models by incorporating machine-learning techniques that predict upcoming variance clusters based on order-book imbalance signals recorded 30 to 60 minutes in advance.
Conclusion
Longitudinal tracking of variance in exchange betting sequences continues to yield repeatable structural patterns tied to liquidity, time zones, and participant density. Datasets released through June 2026 reinforce earlier findings while highlighting gradual shifts in stabilization thresholds as market participation evolves. Researchers maintain ongoing collection efforts across platforms to monitor whether these thresholds continue their recent upward movement or revert under changing conditions.