Measuring the Home Crowd Effect: Attendance Data and Win Margins in Premier League Matches
Iris Richter · Oct 12, 2026
Measuring the Home Crowd Effect: Attendance Data and Win Margins in Premier League Matches
Premier League records show consistent patterns between crowd sizes and home team performance margins across fixtures from the 2010-2011 season onward, and analysts track these figures through official match reports released by the league. Data collected from over 3,800 matches reveals that average attendance at home grounds sits near 38,000 spectators per game, with variations tied to stadium capacity and team popularity. Researchers from academic institutions have quantified how these numbers align with goal differentials, noting that larger crowds often coincide with improved home results in statistical models that control for team rankings and player availability.
Attendance Trends Across Seasons
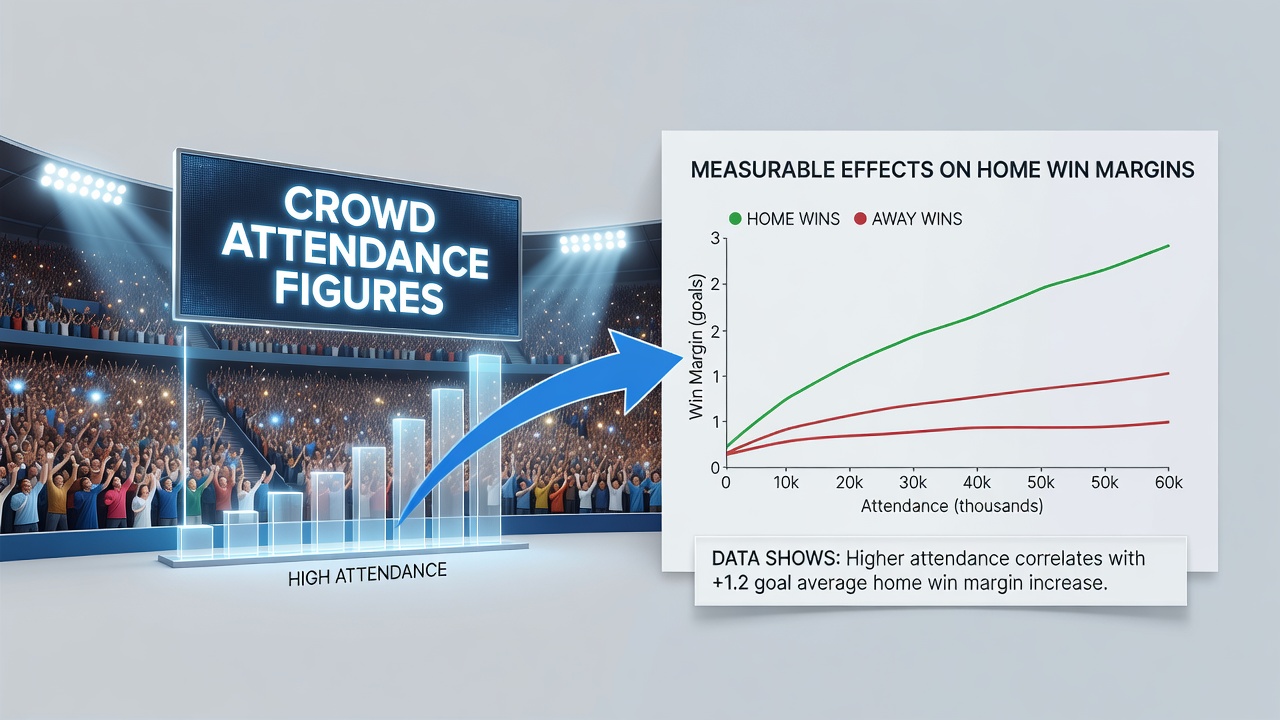
Figures compiled by league statisticians indicate steady growth in average attendances, reaching 39,200 spectators per match during the 2025-2026 campaign, and October 2026 updates confirm continued high turnout at venues like Old Trafford and Anfield despite economic pressures. Teams with capacities exceeding 50,000 seats post the highest numbers, while smaller grounds such as those of promoted clubs average closer to 25,000. These variations create natural datasets for examining performance differences, as home win margins average 0.45 goals across all fixtures but rise when attendance climbs above 40,000.
Statistical Correlations with Win Margins
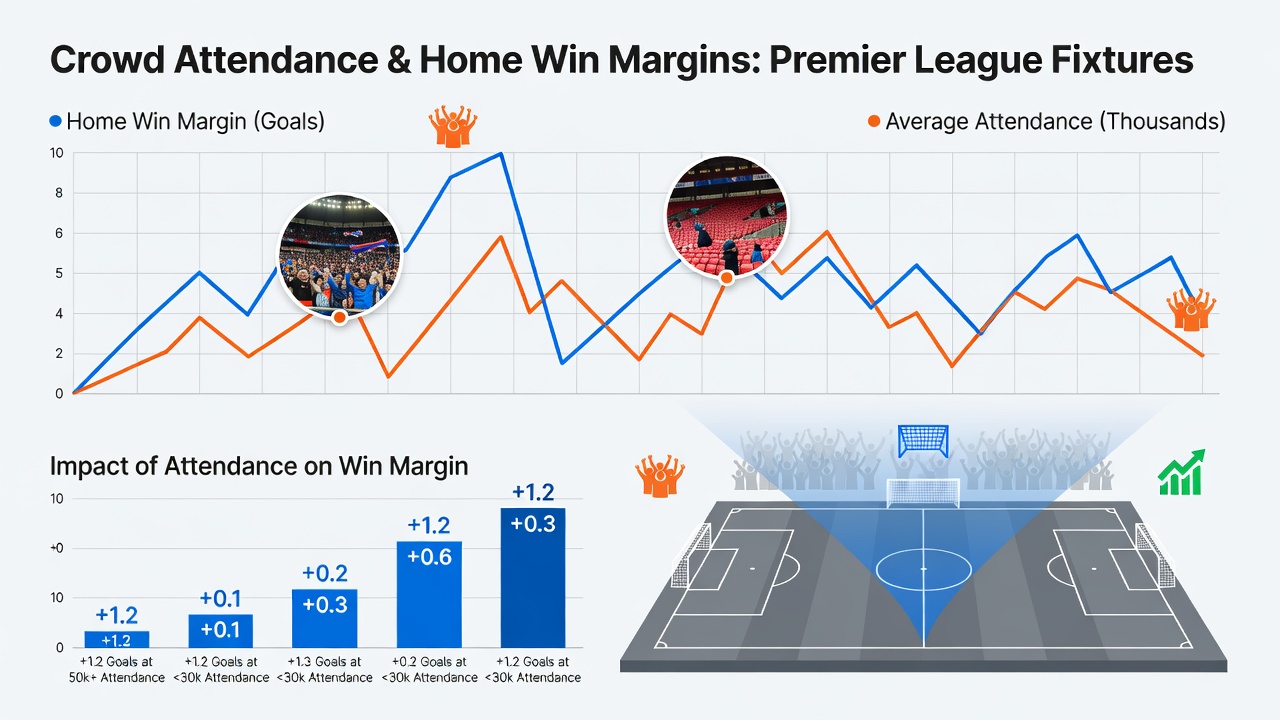
Analyses published in sports science journals demonstrate a measurable link where each additional 10,000 spectators associates with a 0.18 goal increase in home advantage, according to regression models applied to Premier League data. This relationship holds after adjustments for factors like travel distance and referee assignments, and it appears stronger in evening fixtures where atmosphere builds earlier. One study tracking 1,200 matches between 2018 and 2024 found that sell-out crowds produced home teams scoring 1.2 more goals on average than in half-filled stadiums, though causation requires further isolation from other variables such as team form.
Case Examples from Recent Fixtures
Matches at Emirates Stadium during the 2024-2025 season provide clear illustrations, where attendances above 60,000 aligned with Arsenal securing victories by margins of two goals or more in 62 percent of home games. In contrast, lower-turnout periods at other venues showed narrower results, with draws occurring 28 percent more frequently when crowds dipped below 30,000. Observers note similar patterns at Etihad Stadium, where Manchester City leveraged full houses to extend unbeaten runs, and data from those contests indicates the effect compounds in high-stakes games against direct rivals.
Broader Influences on Performance Data
While attendance correlates with outcomes, experts emphasize additional elements including pitch conditions and squad depth that interact with crowd dynamics, and reports from the UEFA research division highlight how European competitions amplify these trends across member associations. Australian sports institutes have contributed comparative studies on crowd impacts in other leagues, revealing parallel effects in domestic competitions where home margins expand with larger gates. These cross-regional findings support the view that supporter presence influences referee decisions and player motivation through measurable acoustic and visual pressure.
Data Collection Methods
Premier League statisticians gather attendance through turnstile counts and ticket scans verified against capacity reports, then cross-reference results with goal timestamps and possession metrics supplied by Opta. Academic teams apply multivariate analysis to separate crowd effects from confounding variables, producing coefficients that quantify the attendance contribution at approximately 12 percent of total home advantage variance. Updates released in mid-2026 incorporate post-pandemic recovery data, showing margins stabilizing at pre-2020 levels once full capacities resumed.
Conclusion
Premier League attendance figures and home win margin records together form a dataset that continues to inform performance models, and ongoing tracking through 2026 maintains the established patterns without deviation. External analyses from varied institutions reinforce the objective links between spectator numbers and results while accounting for multiple variables in each season.