Performance Curves in Major European Basketball Leagues and Their Effects on Live Accumulator Betting
Mara Koch · Jul 17, 2026
Performance Curves in Major European Basketball Leagues and Their Effects on Live Accumulator Betting
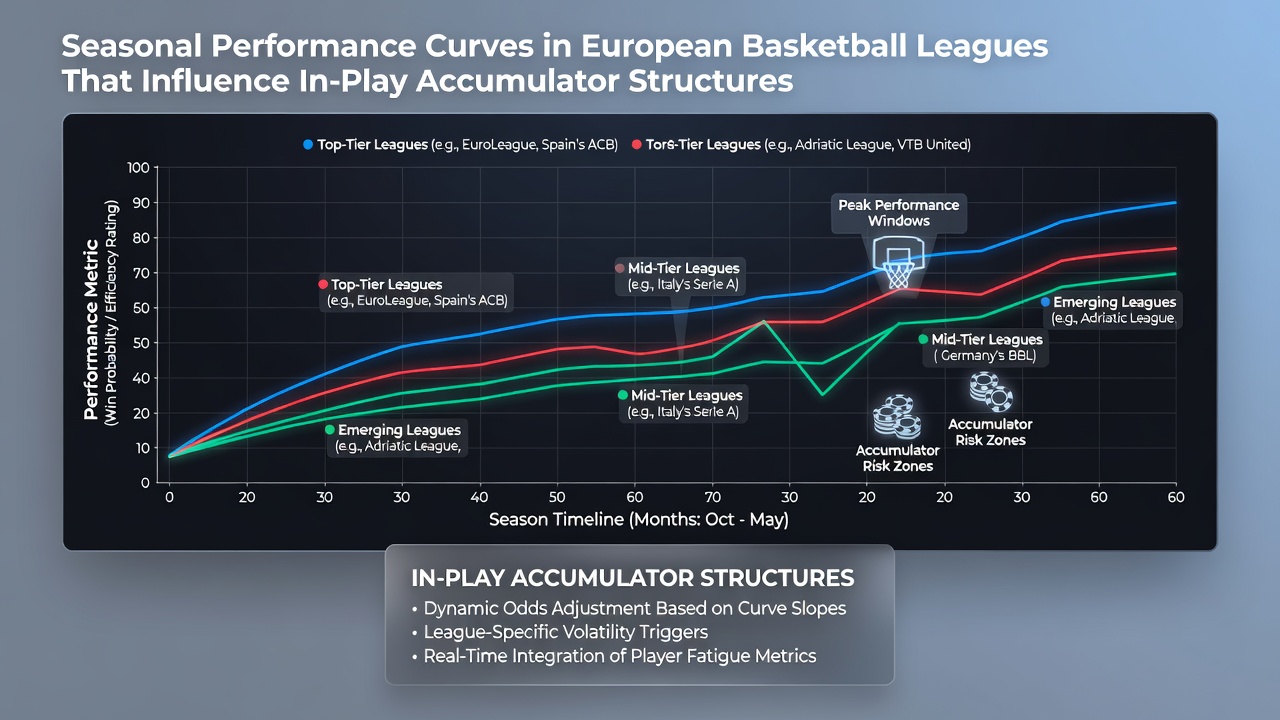
European basketball leagues display distinct seasonal performance curves that shape how bettors construct and adjust in-play accumulator structures throughout a campaign. Teams in competitions such as the EuroLeague, Spanish ACB, adn Italian Lega Basket Serie A follow patterns where early-season form, mid-season adjustments, and late-season fatigue influence live betting markets. Data collected across multiple seasons shows that these curves often peak between rounds 12 and 18 before declining as injury lists lengthen and travel demands increase.
Analysts track metrics including points per possession, defensive rating shifts, and player rotation efficiency to map these trajectories. When a squad starts with an 8-2 record yet registers declining offensive efficiency after round 15, live accumulator builders frequently pivot away from that team in multi-leg wagers. Such adjustments become critical because in-play odds move rapidly once real-time statistics reveal deviations from expected curves.
Mapping Curves Across Key Competitions
The EuroLeague presents the most data-rich environment for curve analysis because its 18-team format spans October through May with consistent scheduling. Historical figures reveal that teams finishing in the top four at the midpoint of the regular season convert those positions into playoff appearances 78 percent of the time, according to league archives. Bettors who monitor rolling five-game averages for rebound rate and assist-to-turnover ratio can identify squads whose curves are flattening before the market fully prices the decline.
Domestic leagues add another layer because their shorter travel schedules and varying roster rules create different inflection points. In the ACB, for instance, teams often experience a sharper mid-January dip linked to Copa del Rey preparation, while Serie A squads show steadier curves until the spring playoff push begins. Observers note that these league-specific rhythms allow experienced accumulator constructors to stagger legs across competitions, pairing a strong early-curve side from one league with a late-curve side from another.
Live Accumulator Mechanics and Curve Integration
In-play accumulators combine multiple live selections whose odds update continuously. When performance curves deviate from seasonal norms, the value of certain legs changes within minutes. A team whose three-point shooting has fallen 6 percent below its season average over the past four games becomes a less attractive underdog in a live parlay even if the pre-match line suggested otherwise. Bettors therefore embed curve-monitoring tools into their decision frameworks, watching for statistical thresholds that trigger automatic adjustments to stake distribution or leg selection.
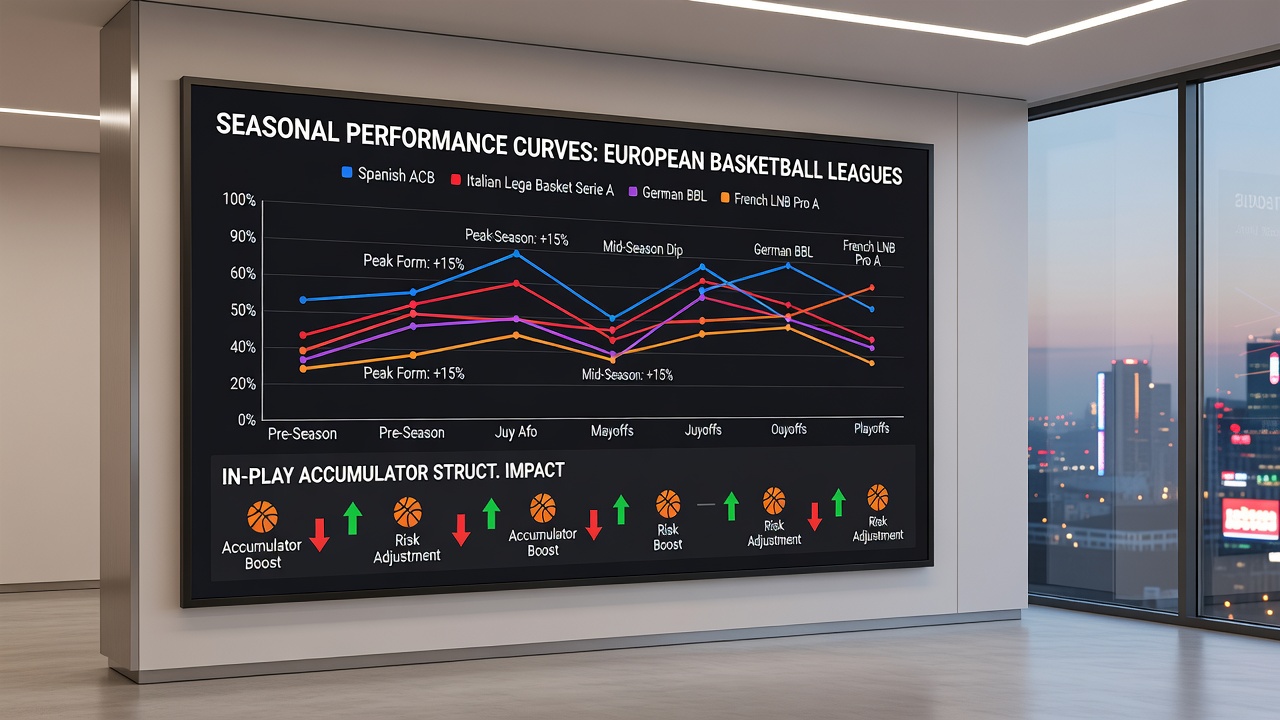
Research conducted by sports analytics groups indicates that accumulators built around identified curve inflection points achieve higher completion rates than those constructed solely on pre-match form. One study covering the 2024-2025 and 2025-2026 seasons found that selections placed after round 20, when fatigue curves steepen, benefited most from real-time defensive rating filters. The same analysis highlighted how teams with back-to-back road games in December and January frequently underperform projected totals, creating repeatable opportunities for live over/under adjustments within accumulator structures.
July 2026 Off-Season Data Releases
As of July 2026, several European federations released updated datasets covering the completed 2025-2026 campaign, allowing fresh curve modeling before the next season tips off. These releases include granular player-tracking information that reveals how minute restrictions and load management altered late-season trajectories. Bettors reviewing the new figures have begun recalibrating models to account for expanded rest protocols implemented by multiple EuroLeague clubs. The additional context helps refine expectations for early 2026-2027 fixtures where historical curves may shift due to altered preparation schedules.
Case Examples from Recent Seasons
Take the trajectory of a mid-table EuroLeague side that posted a 6-4 start yet saw its net rating drop from +4.2 to -1.8 by round 22. Live accumulator builders who noticed the three-game slide in defensive rebound percentage could exclude that team from future legs even while its pre-match spread remained attractive. Similar patterns appeared in the German Bundesliga where one club maintained elite offensive efficiency through February before a 12 percent drop in second-half scoring during March road games altered live total projections.
Another illustration involves Italian clubs whose curves flatten after Coppa Italia quarterfinal exits. Historical data shows a measurable increase in turnover rate during the subsequent two weeks, prompting accumulator constructors to favor opponent overs or team unders in those windows. These examples demonstrate how curve awareness translates into concrete leg-selection criteria rather than broad seasonal narratives.
Conclusion
Seasonal performance curves supply a measurable framework for refining in-play accumulator construction across European basketball. By combining league-specific timing data with real-time statistical thresholds, participants can align selections with documented inflection points rather than relying on static pre-match assessments. Continued releases of detailed tracking information, including those issued in July 2026, will further sharpen these models as the sport evolves.