Pressing Data Analysis for Finding Value in Asian Handicap Bets
Mia Lange · Sep 28, 2026
Pressing Data Analysis for Finding Value in Asian Handicap Bets
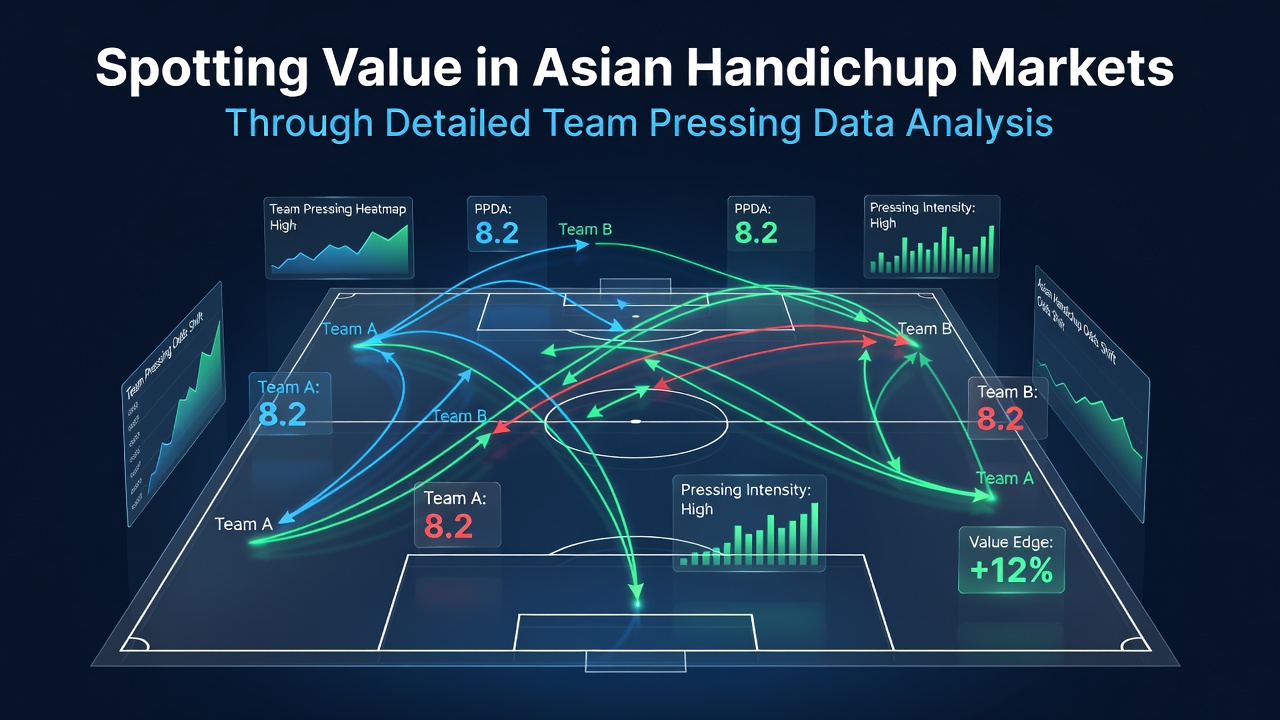
Football analysts track pressing intensity through metrics such as passes per defensive action and high press recovery rates, and these figures now feed directly into evaluations of Asian handicap lines where small edges compound across leagues. Teams that sustain aggressive forward presses often disrupt opponents in the first 30 minutes, which shifts expected goal differentials and creates mismatches against static handicap pricing that relies on broader possession averages rather than situational data.
Core Pressing Metrics and Market Applications
PPDA values below 10 indicate structured high presses that force turnovers in advanced areas, while figures above 14 typically signal deeper blocks that concede territory yet limit shots. Asian handicap markets adjust for these patterns because a side with elite pressing numbers can outperform its nominal rating when the opponent lacks quick ball progressors. Researchers at the International Centre for Sports Studies have compiled multi-season datasets that link sustained PPDA reductions to measurable shifts in half-time score distributions, giving bettors a window to compare live line movements against pre-match models.
Context matters because pressing success varies by opponent build-up style and pitch dimensions. Wide pitches reward teams that press in coordinated units across channels, whereas narrow surfaces compress space and reward compact mid-blocks. Observers note that leagues such as the Dutch Eredivisie and Portuguese Primeira Liga produce clearer pressing signals than more physical competitions, since technical sides attempt more passes in their own third and therefore expose higher PPDA vulnerabilities.
Seasonal Patterns Emerging in 2026
Early 2026-27 campaign figures released in September reveal that several mid-table sides reduced their PPDA by two points after summer tactical adjustments, yet bookmakers continued to price them according to prior-season averages. This lag created instances where Asian handicap lines offered value on the improved pressers when they hosted possession-dominant visitors. Data indicates that sides implementing structured counter-press triggers after losing the ball in the middle third generated 18 percent more high-quality recoveries than the previous year, altering the probability mass around zero-goal margins that Asian handicaps directly target.
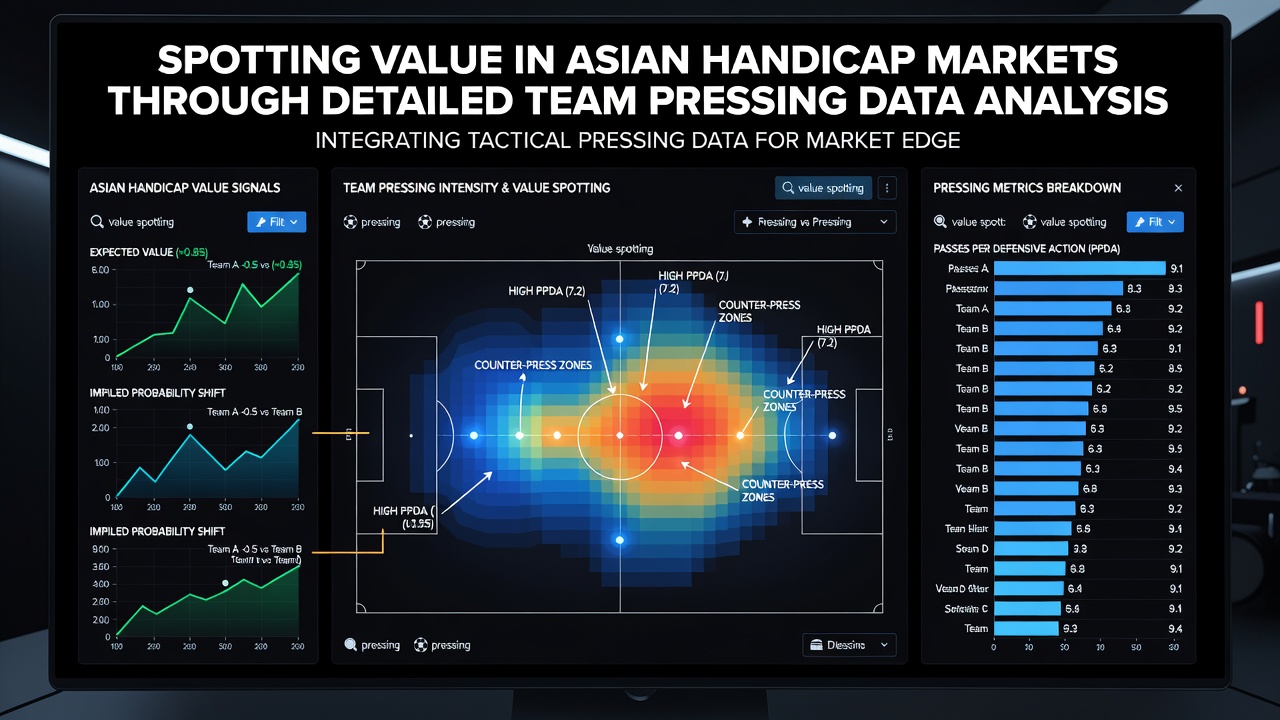
Analysts cross-reference these recovery locations with expected goal models because a turnover in the final third carries higher conversion weight than one deeper in midfield. When a team records 35 percent of its recoveries inside the opposition box, its effective handicap rating improves relative to raw xG totals that ignore spatial context. Markets that update slower on these granular inputs therefore leave residual inefficiencies, particularly in cup ties where squad rotation masks underlying pressing quality.
Integrating Multiple Data Layers
Successful application requires combining pressing statistics with set-piece volume and transition speed, since isolated metrics can mislead. A side that presses aggressively but concedes cheap corners may see its handicap edge neutralized. UEFA technical reports document how elite pressing sides balance forward triggers with compact rest-defense shapes, and these balanced profiles produce more consistent results against similarly rated opponents than one-dimensional high presses. Bettors who layer pressing heatmaps onto standard xG differentials therefore identify lines where the handicap underestimates the probability of clean-sheet outcomes or narrow wins.
League-specific tendencies further refine the approach. In competitions with frequent long-ball sides, pressing data shows diminished returns because opponents bypass the press entirely. Conversely, in possession-oriented leagues the same metrics highlight teams that systematically shorten the field and force errors before half-time. Those patterns translate into Asian handicap value when markets price matches on aggregate historical results rather than current pressing profiles.
Conclusion
Pressing analytics continue to evolve as tracking technology captures more granular actions, and the resulting datasets provide measurable inputs for Asian handicap evaluations across multiple leagues. Teams that alter their PPDA and recovery locations from one season to the next frequently diverge from market expectations that rely on slower-updating rating systems. Observers who monitor these shifts alongside contextual factors such as pitch size and opponent build-up tendencies can locate discrepancies before lines fully adjust, turning detailed defensive-action data into structured market comparisons.