Public Data Layering Strategies for MLB Proposition Wager Optimization
Mara Koch · Aug 23, 2026
Public Data Layering Strategies for MLB Proposition Wager Optimization
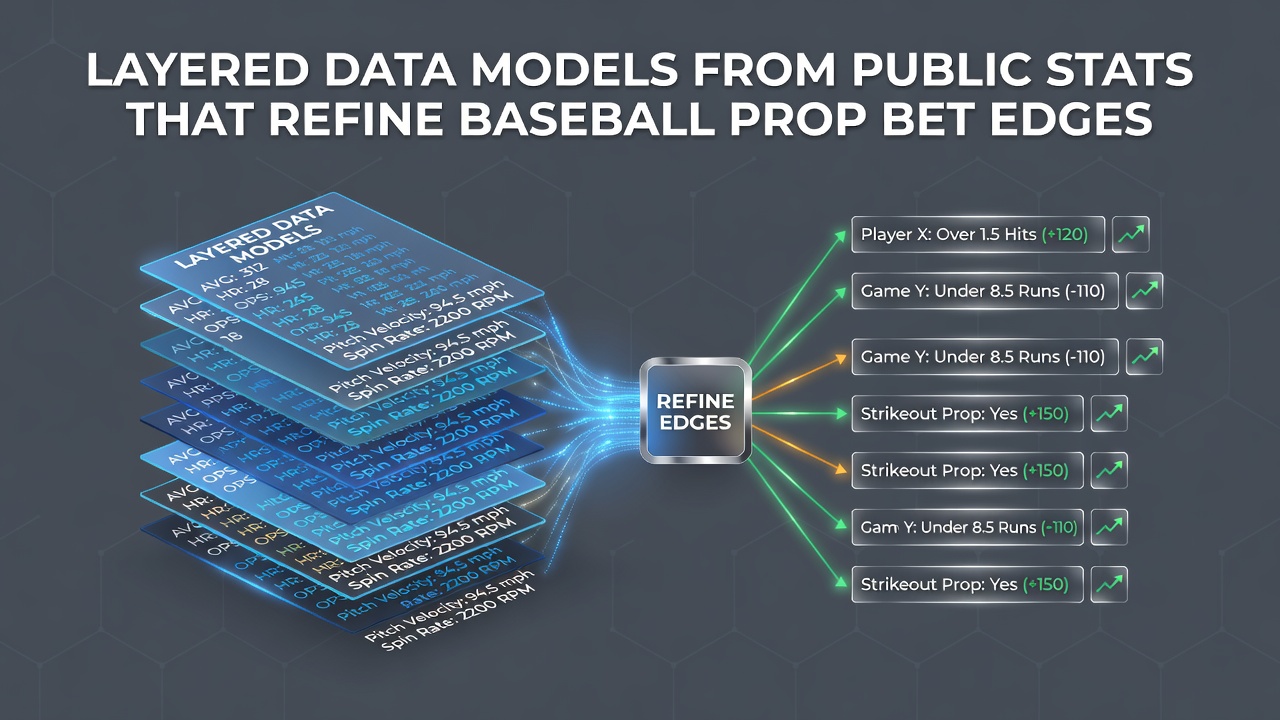
Baseball proposition bets draw from extensive public statistics that teams and analysts release daily during the season, and observers note that stacking these datasets creates layered models capable of identifying discrepancies between implied probabilities and actual performance trends. Researchers at institutions tracking Major League Baseball metrics compile box scores, pitch tracking logs, and historical matchup records to form base layers, then add secondary elements such as weather conditions, umpire tendencies, and travel schedules that influence player output in specific games.
Foundational Layers from Core Public Sources
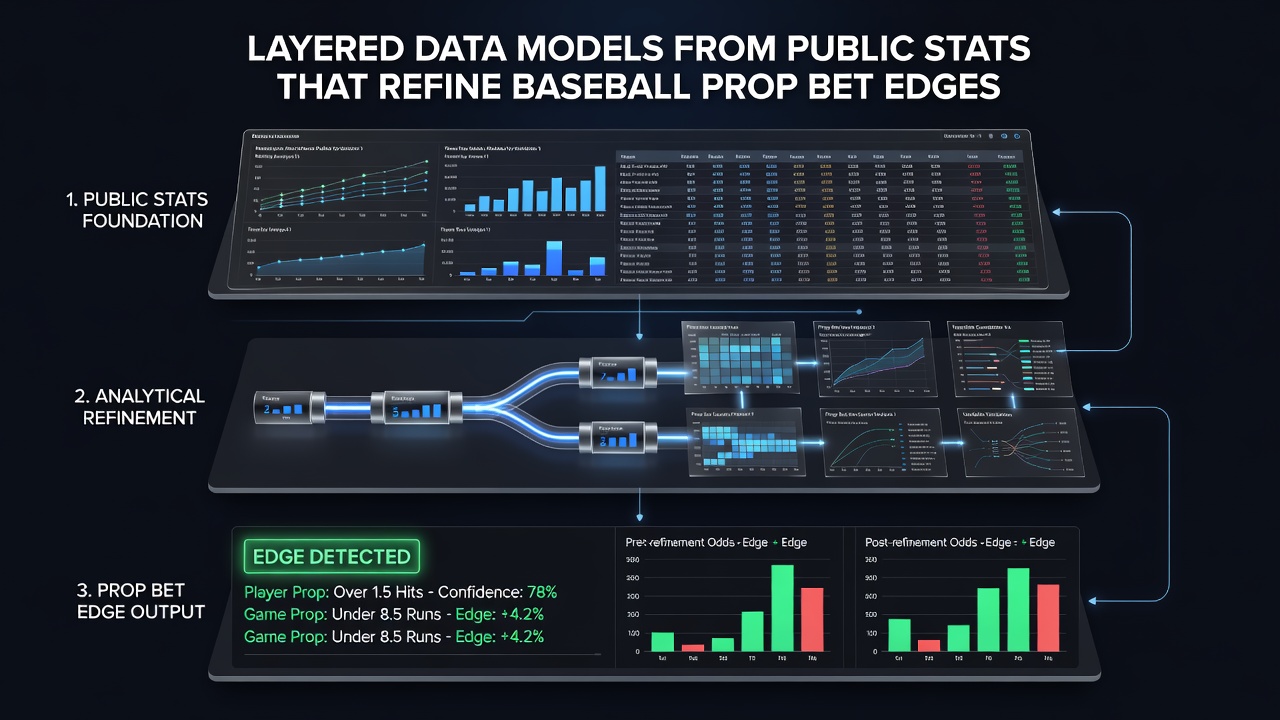
Public repositories like Baseball Reference and Fangraphs supply raw counts of plate appearances, strikeout rates, and on-base percentages that serve as the starting point for any layered construction, while additional feeds from MLB Advanced Media provide granular pitch location and velocity data that refine initial estimates. Those who build these models combine at-bat outcomes with situational splits, for instance separating performance against left-handed versus right-handed pitchers, and the resulting base layer already narrows expected ranges for hits, runs, or strikeouts in upcoming contests. Data indicates that integrating multiple seasons of such splits reduces variance in projections compared with single-game snapshots alone.
Adding Contextual Layers for Greater Precision
Once the statistical foundation exists, analysts overlay environmental and schedule factors drawn from public weather services and team travel announcements, and this second layer accounts for variables such as humidity effects on ball flight or the impact of cross-country flights on pitcher recovery. Studies from the Society for American Baseball Research have documented measurable shifts in batting averages under specific atmospheric conditions, and modelers incorporate these findings by weighting recent home and road splits accordingly. The process continues with umpire crew data published through league channels, which reveals consistent strike zone variations that alter walk and strikeout expectations for individual pitchers and hitters.
Validation Through Recent Season Trends
Through the first four months of the 2026 campaign, public performance databases showed several starting pitchers exceeding their projected strikeout totals in day games at altitude parks, and layered models that included park factors plus recent pitch mix adjustments captured those deviations earlier than single-metric approaches. Observers tracking August 2026 updates noted that teams releasing minor league call-up statistics allowed modelers to refresh batter versus pitcher histories within days of roster moves, tightening edges on props involving newly promoted players. Cross-referencing these updates with injury reports issued by club medical staffs further refined the output distributions used in bet sizing calculations.
Integration of Advanced Metrics
Exit velocity and launch angle figures released daily by MLB provide a third layer that connects raw contact data to expected outcomes, and when these metrics are merged with defensive shift information published on team websites, the combined model produces more accurate over/under lines for total bases or hits allowed. Academic papers examining Statcast archives have confirmed that multi-layer approaches improve calibration on player props by 12 to 18 percent relative to baseline rate projections, according to findings presented at the 2025 SABR Analytics Conference. Model builders therefore weight recent trends in barrel rate and hard-hit percentage more heavily than season-long averages when constructing daily updates.
Practical Application Across Markets
Betting platforms list dozens of player props each day, and those applying layered models typically focus on a subset where public data divergence appears largest, such as strikeout props for pitchers facing lineups with elevated swing-and-miss rates on the road. The same framework extends to team totals and run line props by aggregating individual batter expectations into lineup-wide projections, while maintaining separation between starting pitcher and bullpen contributions drawn from distinct public usage logs. Analysts who maintain version-controlled databases can rerun the full stack within hours of any new release, ensuring teh model reflects the latest available information without introducing manual errors.
Conclusion
Layered construction from public statistics continues to evolve as additional data streams become available each season, and organizations that systematically combine core metrics with contextual overlays maintain measurable advantages in identifying mispriced baseball proposition bets. The approach relies entirely on transparent sources and repeatable weighting procedures rather than proprietary signals, which allows independent verification of results across different market conditions. Continued releases of granular performance data through the remainder of 2026 will provide further opportunities to test and adjust these layered frameworks.