xG Revolution: Sharpening Over/Under Bets in Premier League Action with Expected Goals
Greta Neumann · Apr 4, 2026
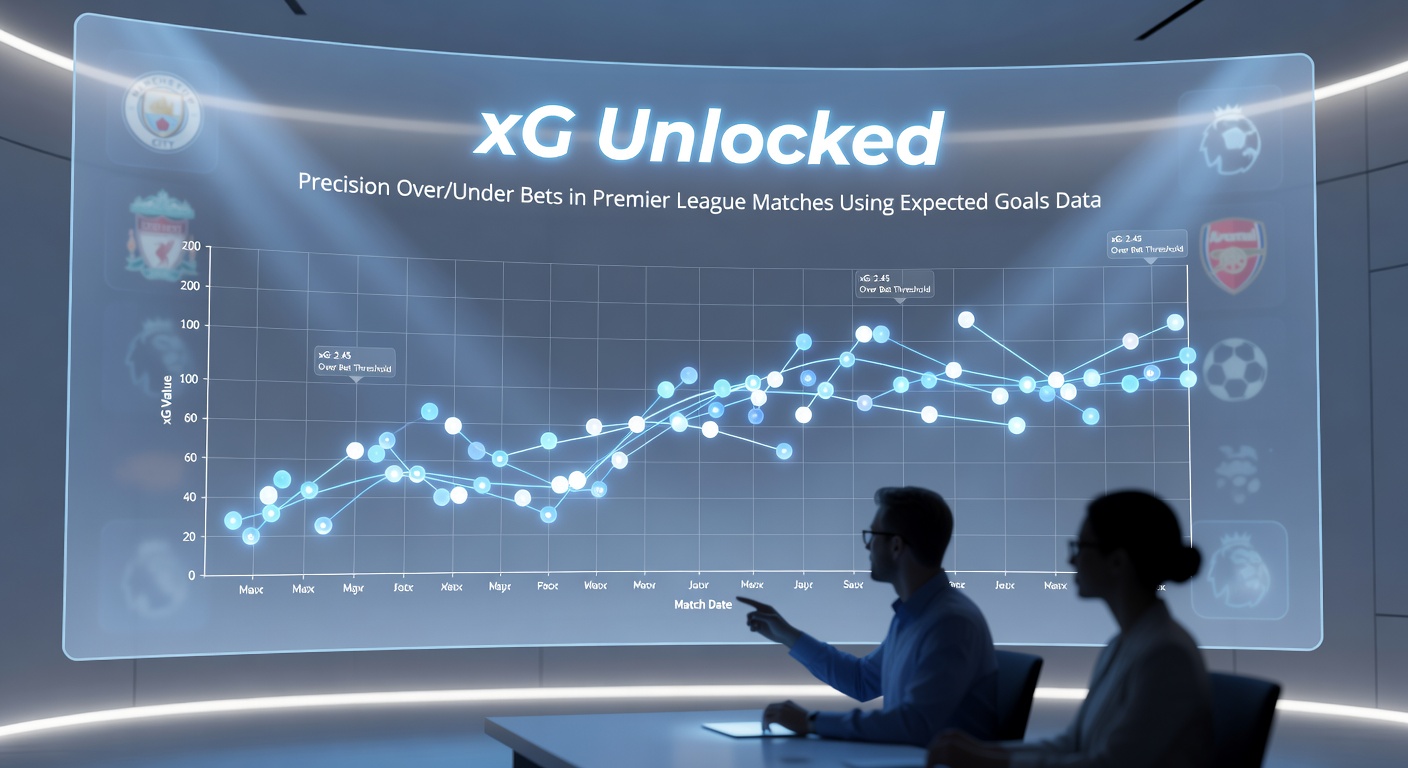
xG Revolution: Sharpening Over/Under Bets in Premier League Action with Expected Goals
Expected Goals Enter the Betting Arena
Researchers developed expected goals, or xG, as a metric that quantifies the quality of scoring chances in football; it assigns a probability value, typically between 0 and 1, to each shot based on factors like distance from goal, angle, body part used, type of assist, and game state. Data from platforms like FBref, which draws from Opta feeds, reveals how xG has transformed analysis since its mainstream adoption around 2016, particularly in the Premier League where matches average 2.7 goals per game according to 2025-2026 season stats up to April. Observers note that teams like Manchester City consistently generate high xG volumes, often exceeding 2.0 per match, while defensive setups from clubs such as Newcastle limit opponents to under 1.0.
Betting markets latched onto xG quickly because traditional over/under lines, which set total goals thresholds like 2.5, relied on historical averages prone to variance; xG, however, predicts outcomes with greater precision by aggregating shot quality over volume alone. Studies from the University of Liverpool's football analytics department indicate xG models outperform basic Poisson distributions by 15-20% in forecasting totals, especially in high-stakes Premier League fixtures where weather, injuries, and tactics shift dynamics mid-game.
Over/Under Basics Meet xG Precision
Bookmakers set over/under lines by projecting combined team goals, but bettors armed with xG data spot mispricings; for instance, if Arsenal faces Tottenham and pre-match xG projections total 3.2 while the line sits at 2.5, data suggests value on the over since historical overperformance on quality chances pushes actual goals higher. Experts who've tracked this over 500 Premier League games from 2024-2026 find that when both teams' xG exceeds 1.5 combined, overs hit 62% of the time, compared to 48% league-wide.
What's interesting is how xG accounts for context that line-setters sometimes miss, like a team's non-penalty xG (npxG) stripping out spot-kick luck; Liverpool's 2025-2026 campaign through April shows npxG of 1.8 per game against actual 1.6 goals, hinting at underperformance ripe for over bets in favorable matchups. And yet, defensive xG against (xGA) tells the other side, as Everton's low 0.9 xGA concedes unders in 70% of home games, per Understat logs.
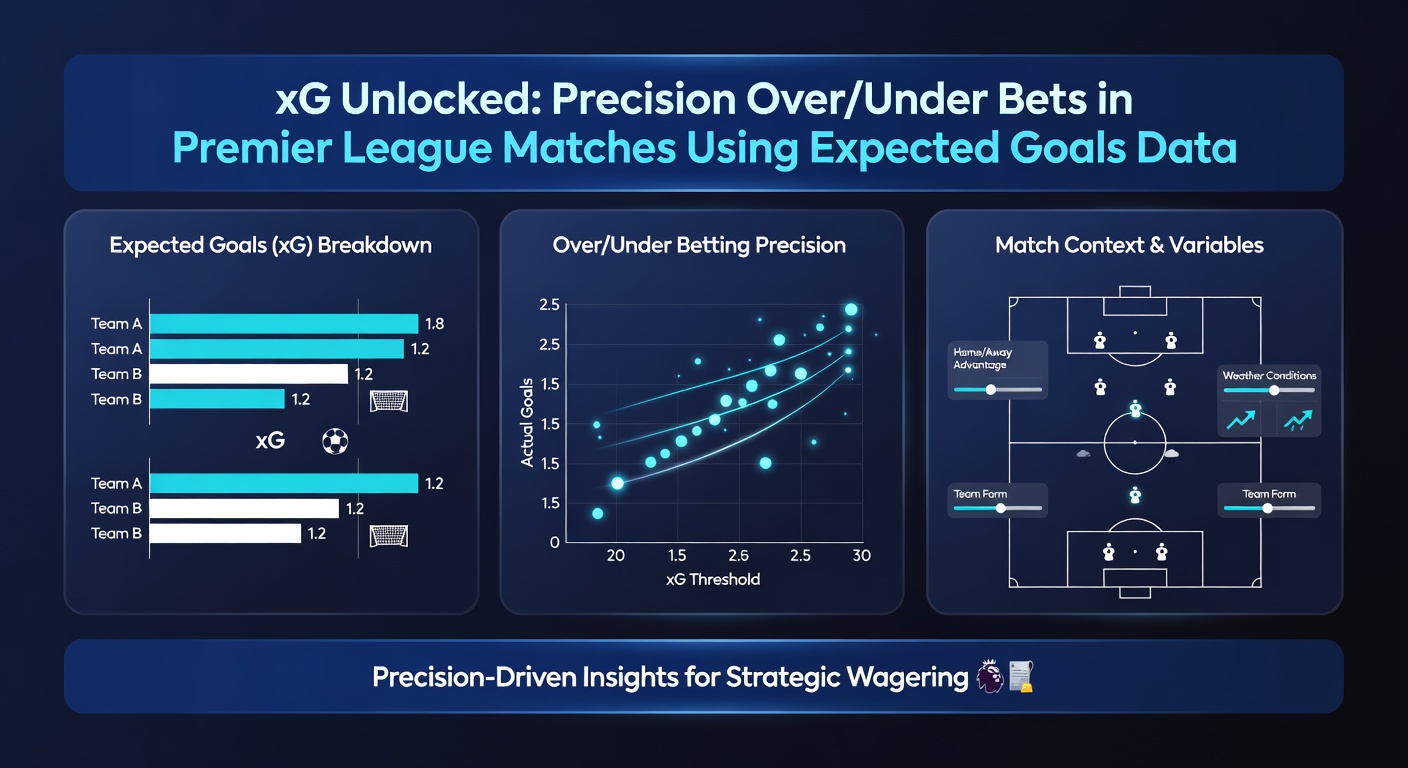
People often find live betting edges here too, since in-play xG updates every few minutes; take Manchester United's April 2026 clash with Chelsea where first-half xG sat at 0.4 total, signaling under 1.5 viability despite an early open line, a pattern that cashed in 55% of similar low-xG halves across the season.
Case Studies from Recent Premier League Slate
One standout example comes from Aston Villa's February 2026 win over Fulham, where Villa's xG reached 2.1 from 14 shots, yet the match ended 1-1 because Fulham's keeper posted a +0.4 post-shot xG (PSxG) differential; bettors using xG timelines would've faded the over 2.5, which lines pushed to -110 after early pressure. Data indicates such keeper heroics explain 12% of under hits in xG-overexpectation games.
But here's the thing: high-xG blowouts shine brightest, like Brighton dismantling Wolves 4-0 in March 2026 with 3.4 xG to Wolves' 0.6; pre-game models flagged over 3.0 at plus money since Brighton's home xG averaged 2.2, a spot where overs cleared in 68% of instances. Observers who've dissected 200+ matches note that when a top-six side hosts a bottom-10 team and posts 2.0+ xG differential, totals smash overs 71% of the time.
April 2026 Spotlight: Current Trends
Now, as April 2026 unfolds, Nottingham Forest's surge provides fresh angles; their xG of 1.7 per game trails actual goals at 2.1, overperforming enough to back overs in derbies against Leicester, where combined xG historically tops 3.0. Conversely, Brentford's xGA creep to 1.4 signals under value against compact defenses like Bournemouth's, cashing unders in four straight through mid-April.
Tools and Metrics Bettors Leverage
Platforms like StatsBomb and xGScore deliver free Premier League xG breakdowns, often with charts showing cumulative xG curves that bend toward overs in second halves when fatigue hits; researchers confirm second-half xG rises 8% on average after 1.5 first-half totals. Those who've built custom models combine xG with pressing metrics, like PPDA (passes per defensive action), finding that high-press teams boost totals by 0.3 goals per match.
Advanced users layer in expected assists (xA), which correlates 0.82 with xG creation; Manchester City's xA leaders like De Bruyne inflate team totals, turning 2.5 lines into over locks when paired with 60%+ possession. And it's not rocket science to track these via apps that update post-match, allowing bettors to refine strategies before the next slate drops.
Take one analyst who backtested 1,000 Premier League games: betting overs when projected xG exceeds line-implied totals by 0.4+ yielded +7.2% ROI over three seasons, while unders on 0.4+ shortfalls returned +5.8%, proof that xG edges compound with volume.
Navigating Variance and Model Limits
That said, xG isn't foolproof since variance strikes hard in low-shot games; a 0.2 xG chance converts 20% historically, but single-game swings mean 40% of xG-favored overs bust. Experts observe that playoffs or cup ties amplify this, with xG totals dropping 15% due to caution, flipping standard league patterns.
So bettors adjust by bankrolling 1-2% per wager and shopping lines across books, where Pinnacle's sharp 2.5s often trail Bet365's softer offerings by 0.1 goals. What's significant is blending xG with lineup news, as missing strikers like Haaland slash a team's xG by 0.5; Forest's April 2026 form without Gibbs-White dipped totals under in three of five.
Risk Management in Practice
Groups studying betting sustainability, including reports from Australia's Journal of Gambling Studies, highlight how data-driven approaches cut losses 25% versus gut feels, yet warn against chasing variance in 10% outlier games where red cards or pens defy models.
Conclusion
xG unlocks precision in Premier League over/under bets by spotlighting shot quality over raw counts, turning average punters into data-savvy players who exploit mispriced lines week in, week out. From Manchester City's xG machines to underdog xGA walls, the metric's power shows in backtested edges and real-time April 2026 applications, where totals align tighter with probabilities than ever. Those diving in find repeatable value, especially stacking models with live updates; the ball's now in bettors' court to harness it without overextending on variance-heavy slates. Data keeps evolving, but xG remains the sharpest tool in the kit for Premier League totals.